Hello, I am Garland Zhao
I enjoy working on new projects and analyzing data.
I am an aspiring data analyst who loves learning about new technologies and expanding his skill set.
View ProjectsI am an aspiring data analyst who loves learning about new technologies and expanding his skill set.
View ProjectsHello, I am Garland Zhao. I am a recent graduate of Cal Poly Pomona. I graduated with a B.S. in Business Administration with a focus in Computer Information Systems.
I create and work on new projects in my spare time. My data analytics projects are often created based on my interests or desire to improve my abilities. I frequently employ a variety of different programming languages and tools to complete my projects. For data analytics, I use Python, SQL, and Excel. And for visualizations, I use Python libraries and Tableau.
Python
Excel
Tableau
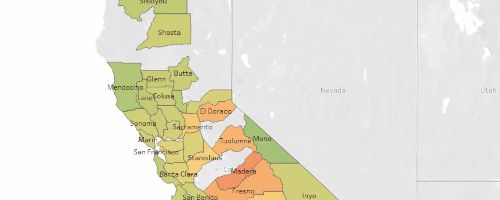
The purpose of this project was to forecast and display the air quality index (AQI) data of California. This project was created with Python, Excel, and Tableau. The forecasting of this project was done with the time series library, Darts. The historical and forecasted AQI data is visualized with Tableau.
Python
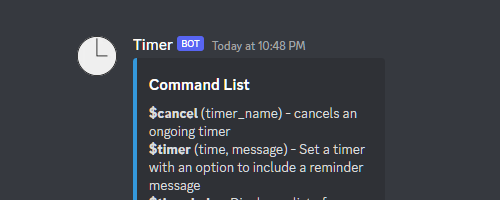
The purpose of this project was to create a discord bot that could serve as a timer. The bot includes various useful features such as the ability to display live countdowns and multiple timers. The bot was created with various different libraries such as discord, asyncio, and pytz.
SQL
Tableau
Power BI
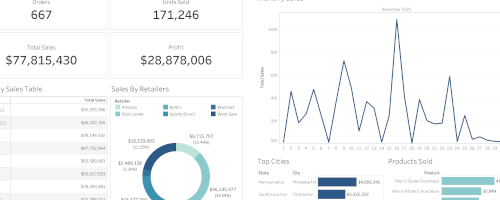
The purpose of this project was to query the Adidas sales data and to display it in an easy to read manner. The sales data was queried based on common business questions. A dashboard was created in Tableau and Power BI to help visualize the data. The dashboards are dynamic and can be used to display monthly data.
Python
SQL
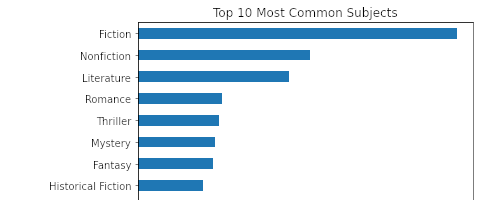
The purpose of this project was to query and analyze the Seattle Public Library data. SQL and Python were used congruently to generate insights. SQL was used to house the data and answer common questions. Python was used for more sophisticated analyzations and visualizations.
Python
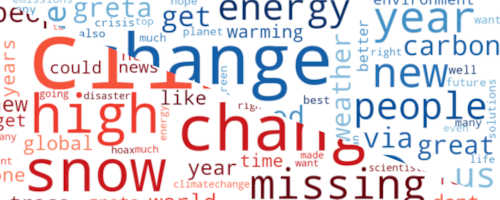
The purpose of this project was to analyze tweets concerning climate change. Tweets were gathered using the Twitter API v2 and analyzed based on their sentiment. The results of this project were visualized in various ways such as pie charts, bar charts, and word clouds.
Python
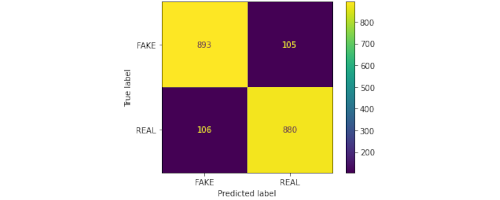
The purpose of this project was to create a classification model that would be able to detect which news articles are fake or not with a high level of accuracy. This project compared 3 different classification models: random forest, multinomial naive bayes, and k nearest neighbors.